The chart that we made in Google Sheets to visually analyze the data only exists in the Google Sheets where we have created it. While we are creating a financial report or making a presentation, it is necessary to have the chart as an image to copy into our documents file. In this guide, we will learn how to save the chart in Google Sheets as an image on our computer.
How to Save the Chart as an Image in Google Sheets?
Once we have created a chart in Google Sheets, the next step is to save the chart as an image to share with someone through Gmail or any other communication source and to create a report on it.
Following are a few methods to save the chart on Google Sheets as an image on our computer, we will discuss each of them one by one.
- Through the Built-in Download Option in Google Sheets
- By publishing the chart on the web
- Through Snip & Sketch Tool
Method 1: Save the Chart From the Built-in Download Option
Google Sheets has a built-in download option to save the chart as an image. This option downloads the chart as an image and directly saves it on our computer.
Click on the Kebab Menu at the top right of the chart and then click on the Download chart from the drop-down menu. In the next drop-down options, click on PNG image (.png) and your chart will start downloading:
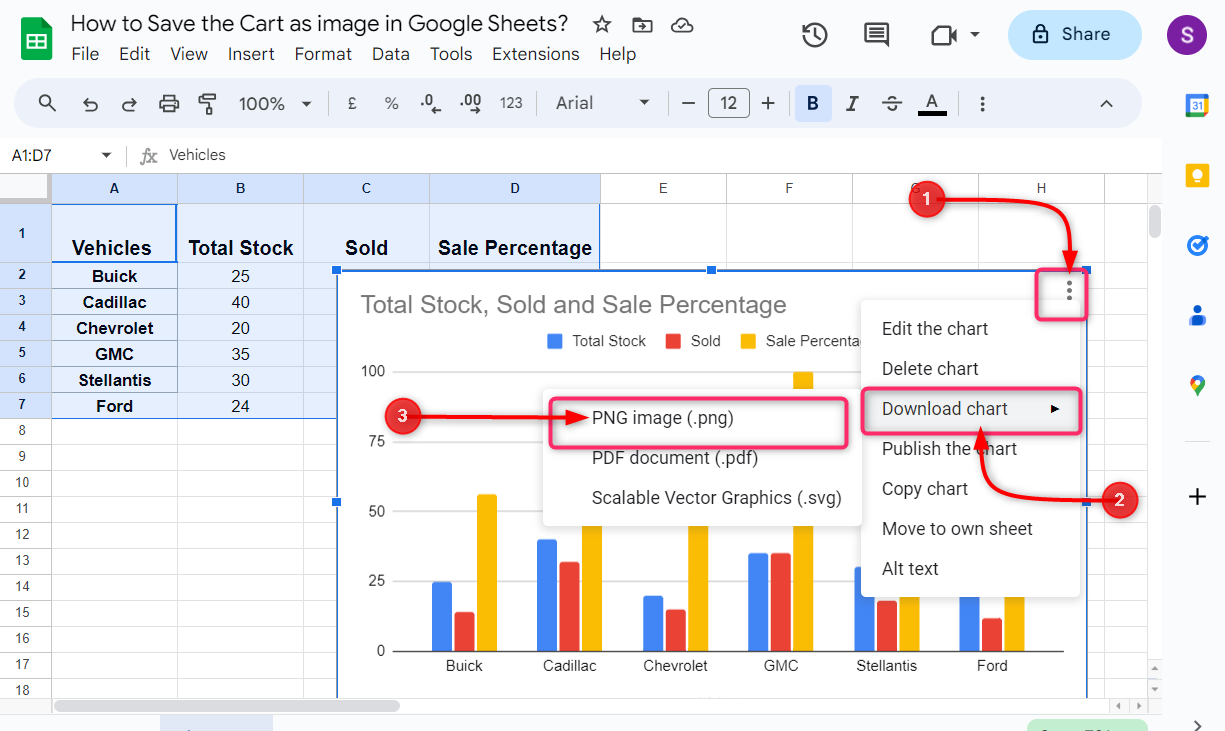
Once the downloading is completed, go to the files directory on your computer to view the downloaded files.
Method 2: Download Chart as an Image by Publishing it on the Web
Although Google Sheets has a built-in option to download the chart as an image, a lot of people find that image quality and resolution are not as good as they should be. We can also download the chart from Google Sheets as an image with much better image quality by publishing it on the web.
Follow the following steps to download the chart you have created on Google Sheets as an image by publishing the chart on the web.
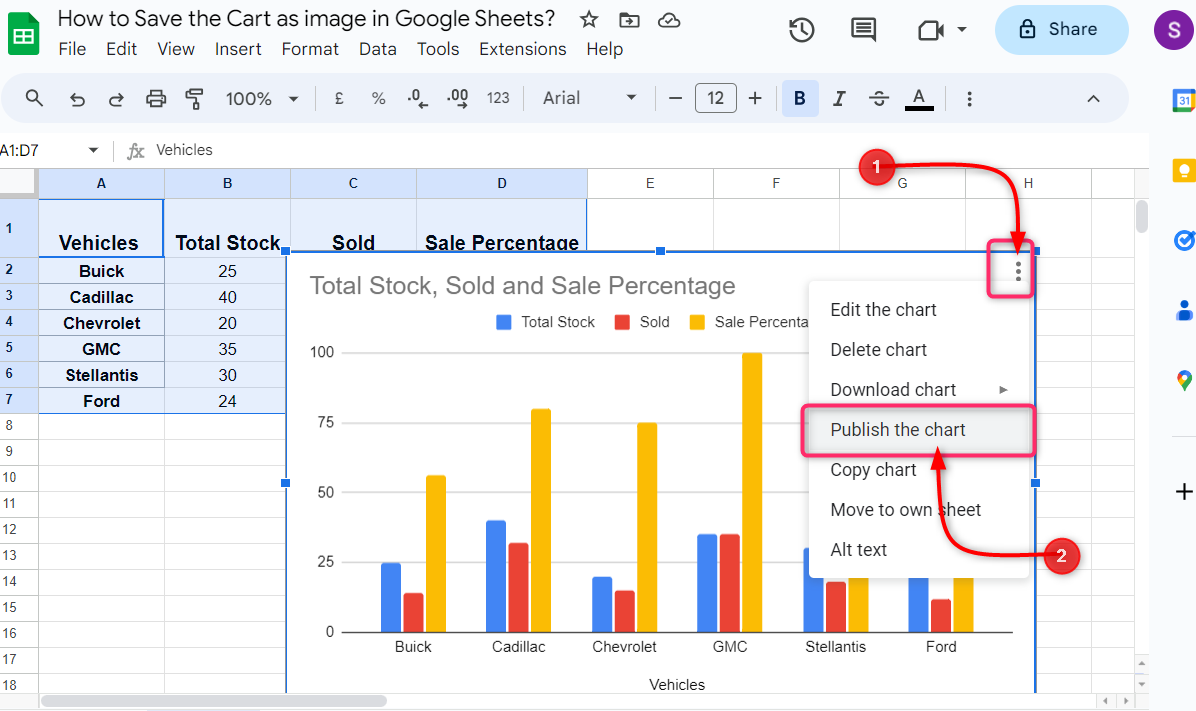
Step 1: Click on the Kebab menu at the top right of your chart in Google Sheets. From the drop-down menu, click on Publish the chart:
Step 2: In the next windows, click on the box under Embed showing as Interactive to change option:
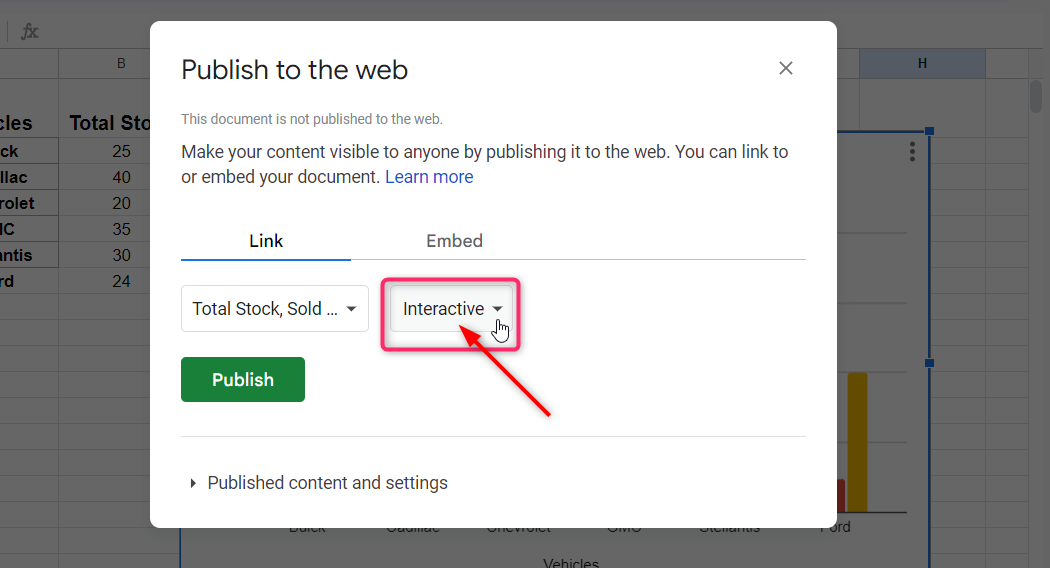
Step 3: From the dropdown, click on the Image option:

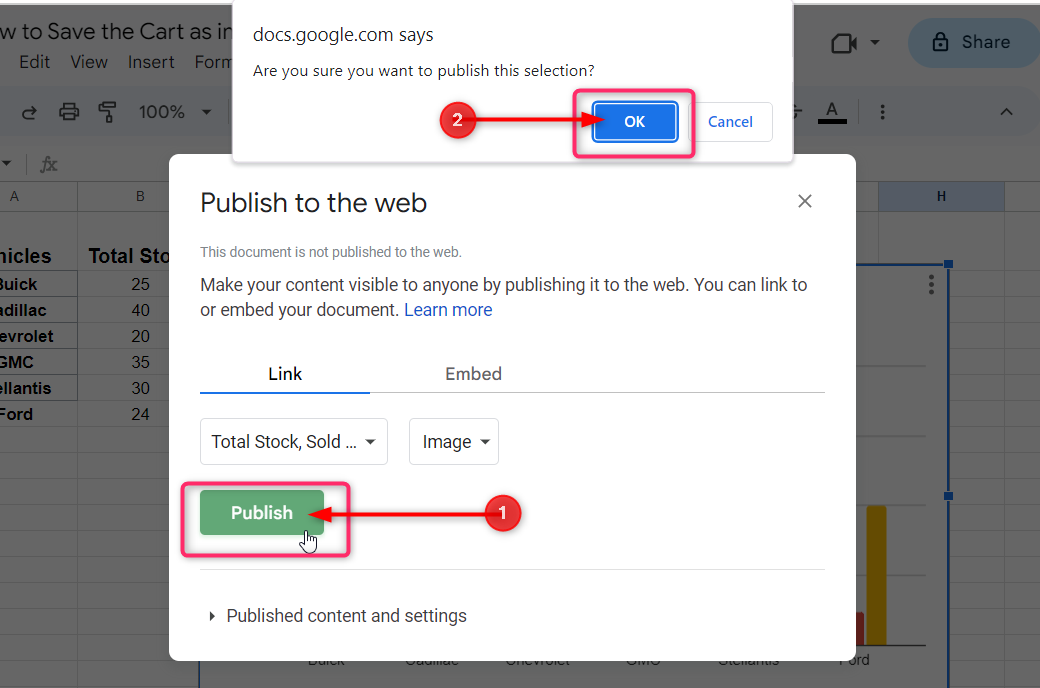
Step 4: Now click on the Publish. A prompt will appear on the browser for confirmation, click on OK to continue:
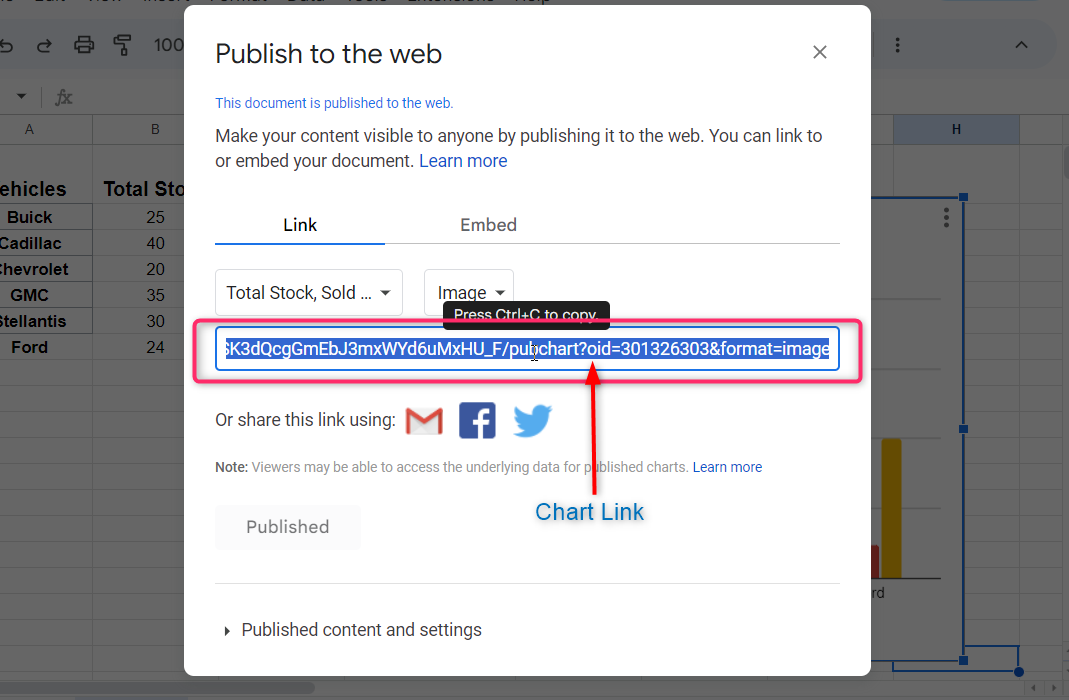
Step 5: Your Google Sheets chart is now published on the web. A link will be generated to access your chart online. You can use this link to share your chart image through Gmail or any other communication platform. Click on the link and press Ctrl + C to copy the link:
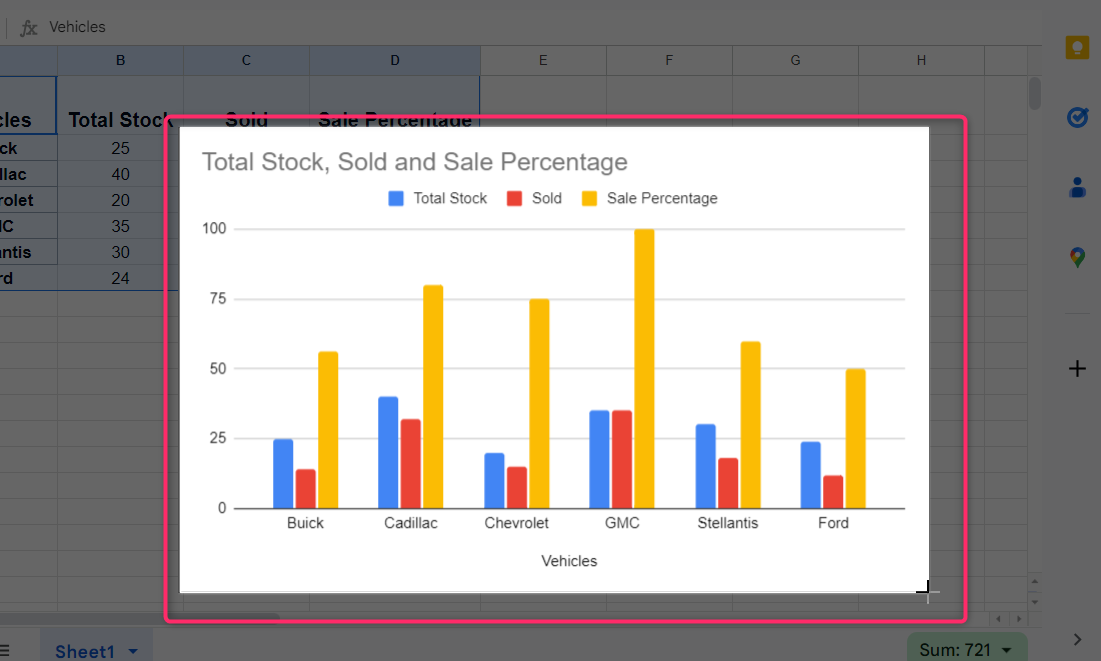
Step 6: Open a new tab in your browser and paste the link to open the chart as an image:
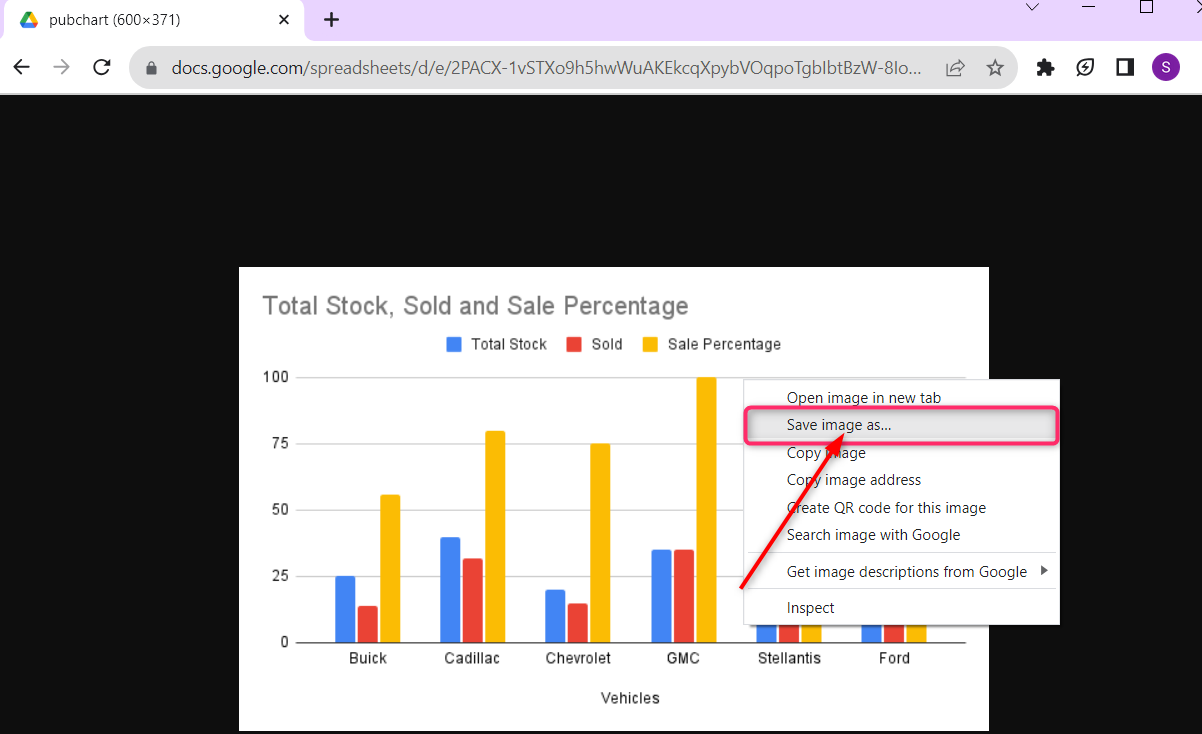
Step 7: Right-click anywhere on the chart image and then click on the Save image as:
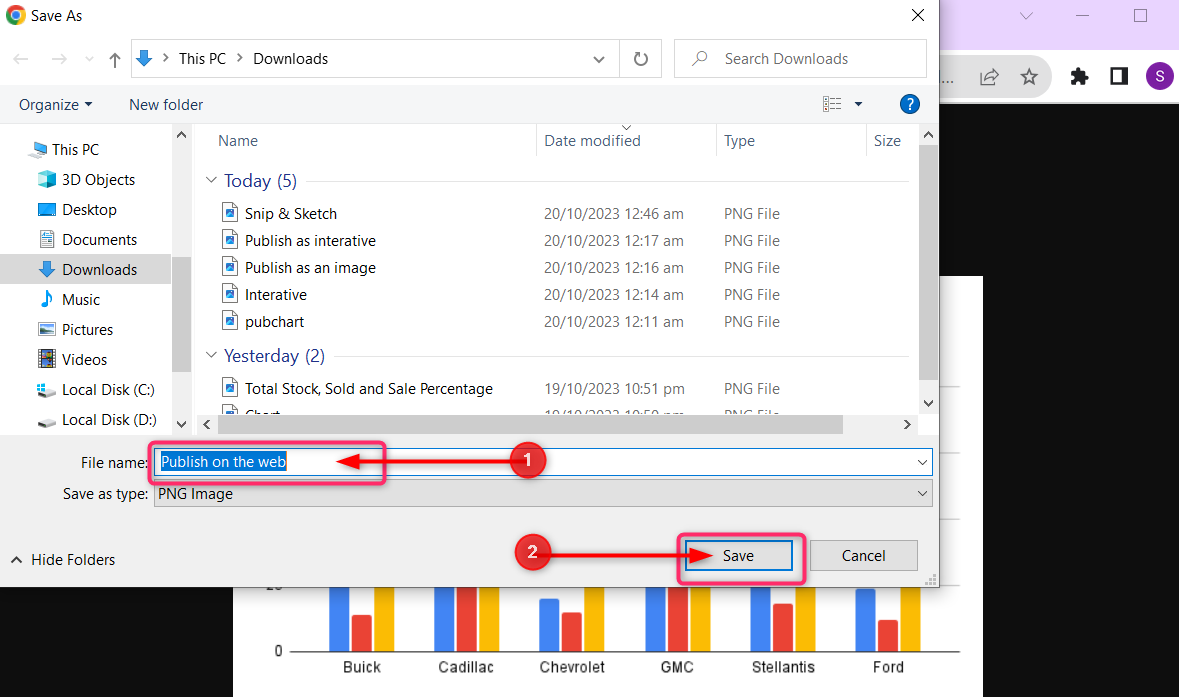
Step 8: Now rename the file name and click on Save to save it on your computer:
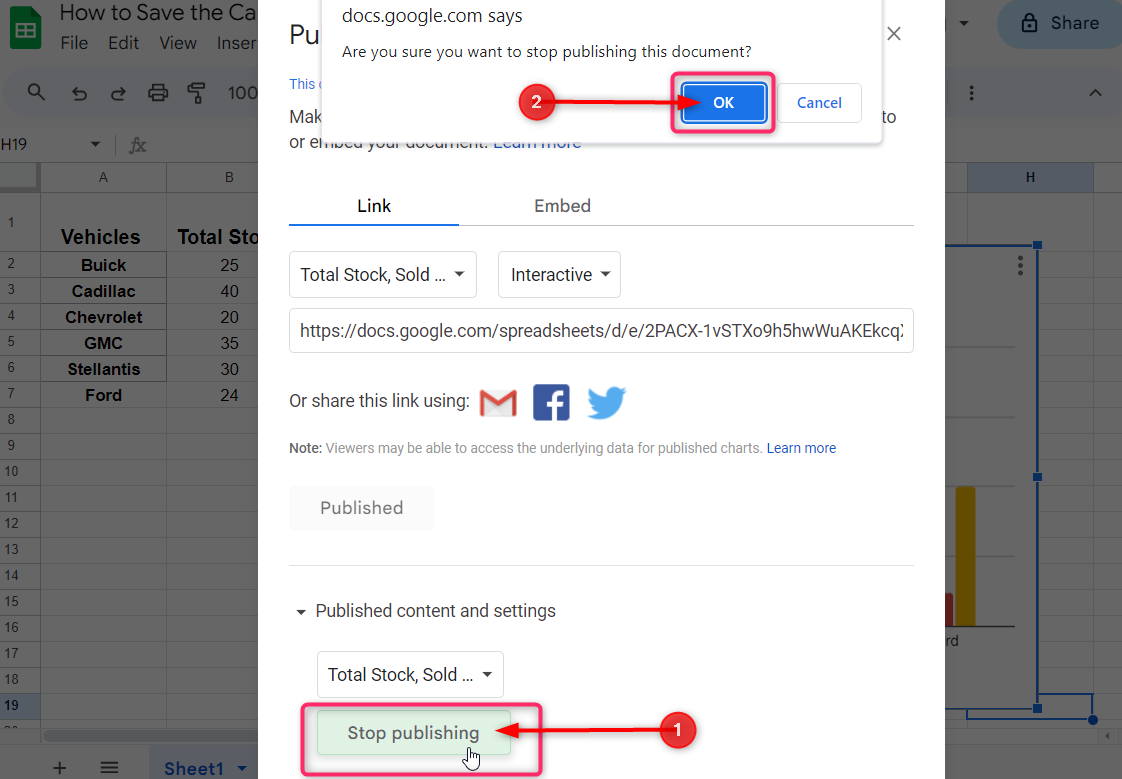
Step 9: Once you have downloaded the image on your computer, go back to your Google Sheets where you created the chart. Again click on the Kebab menu and click on Publish on the web as mentioned above. Click on Stop publishing and then click on OK from the prompt that appears on the browser to stop publishing your chart:
Method 3: Save the Chart as an Image through the Snip & Sketch Tool
Snip and sketch tool allows us to take a screenshot of a specified area on the screen. With this tool, we will take a screenshot of the chart on Google Sheets and save it as an image on the computer. Follow the steps below to save the chart as an image through the snip and sketch tool.
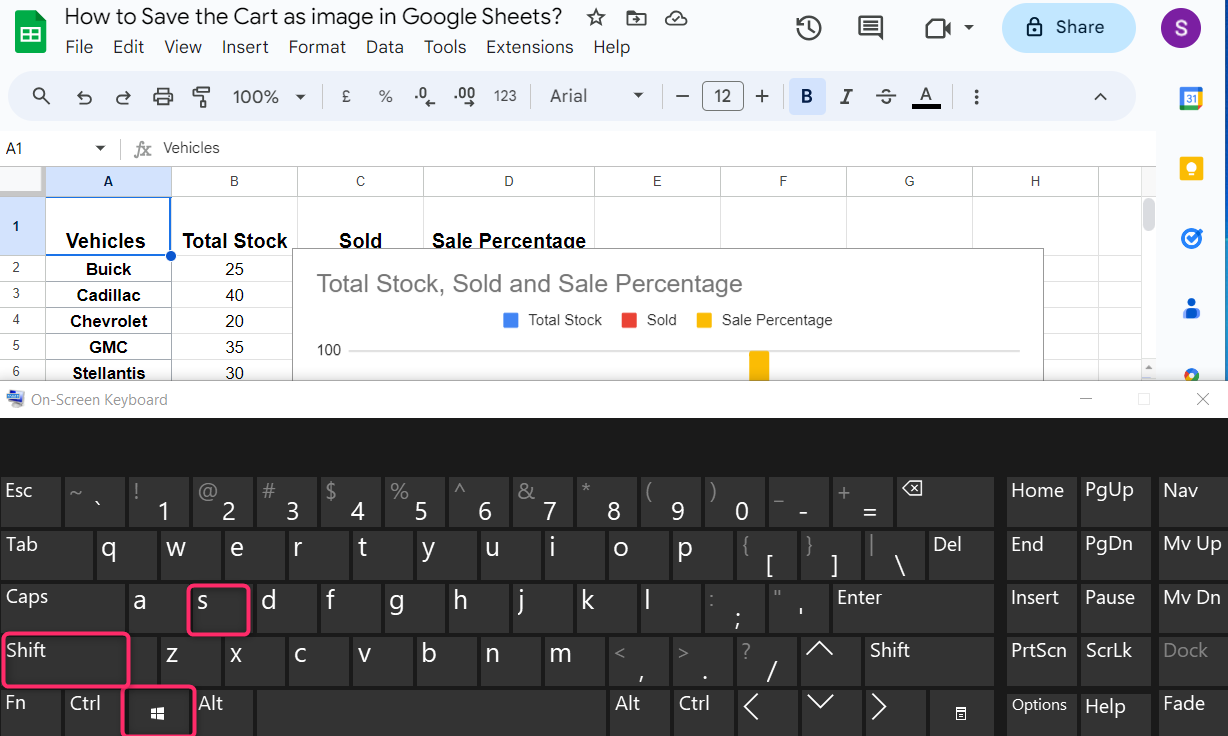
Step 1: Press Windows + Shift + S short keys on the keyboard to take a screenshot:
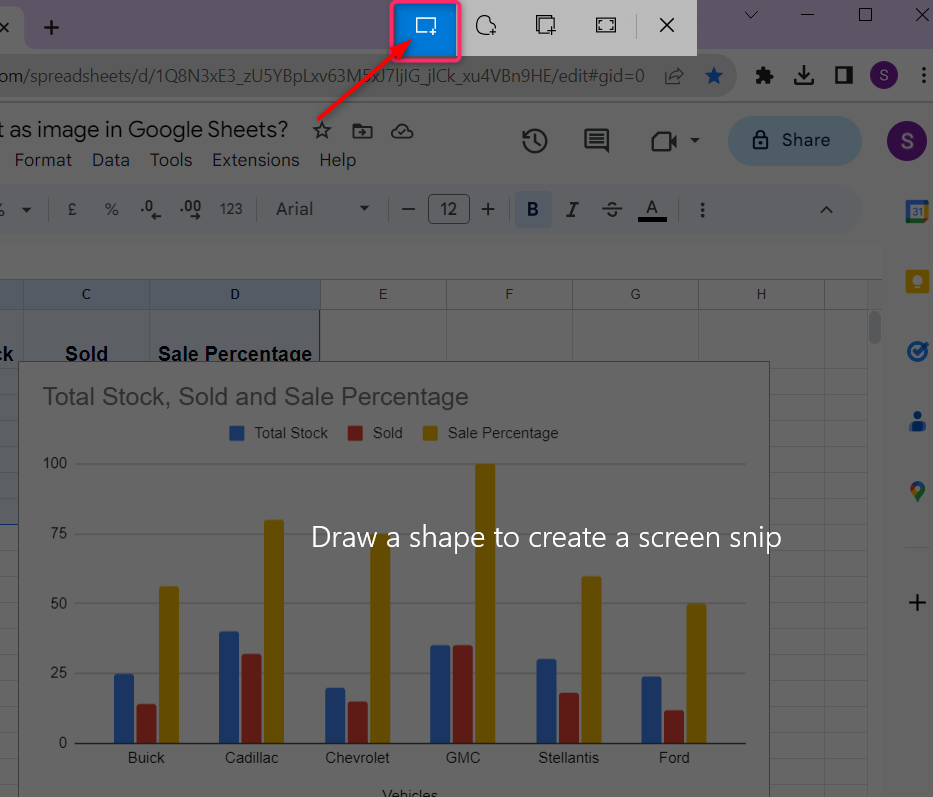
Step 2: This will dim the computer screen and a toolbar will be displayed at the top of the screen. Choose the Snip a Rectangle option from the toolbar:
Step 3: Drag the cursor to crop the area under the chart to take a screenshot of the chart:

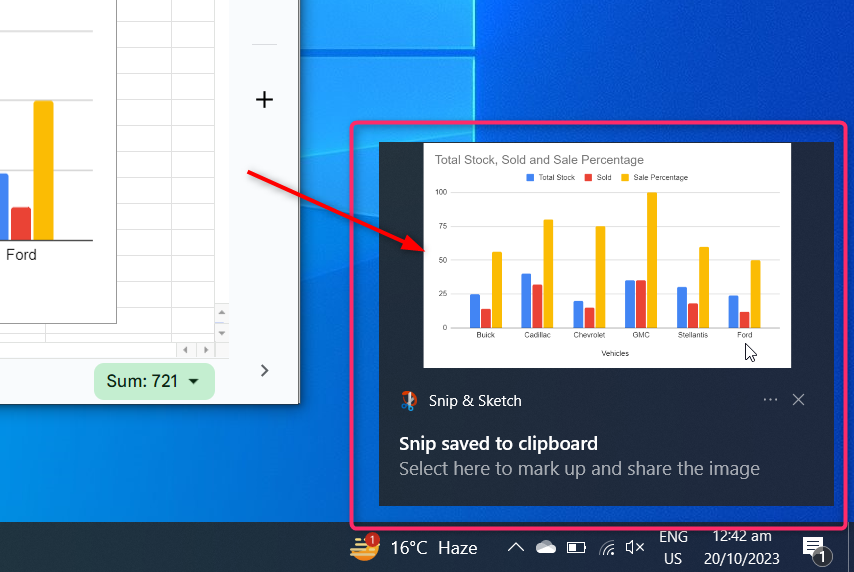
Step 4: Your cropped image for the chart will be saved to the clipboard and will be shown for a few seconds on the left bottom of the window screen. Click on the image to open:
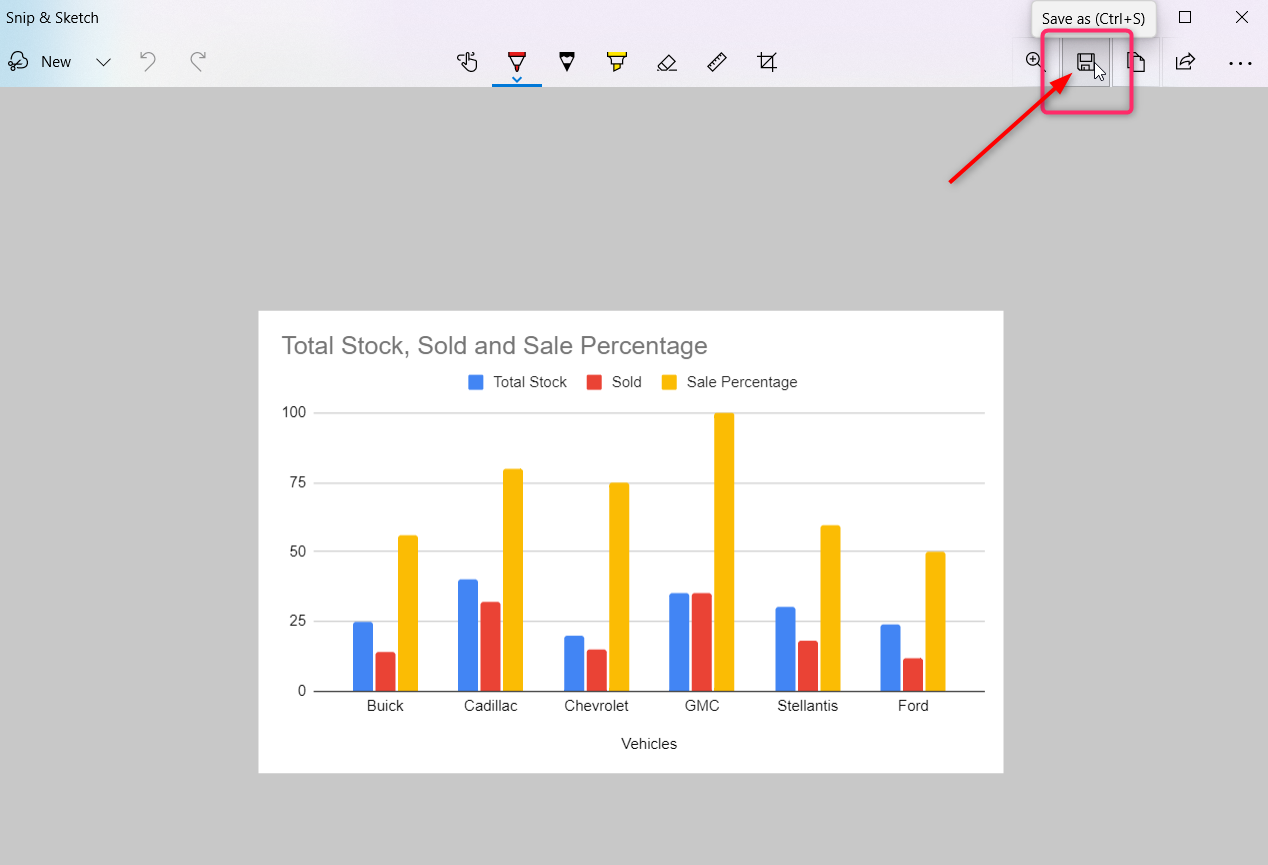
Step 5: Press the Ctrl + S shortcut or click on the Save icon at the top right to save as on your computer:
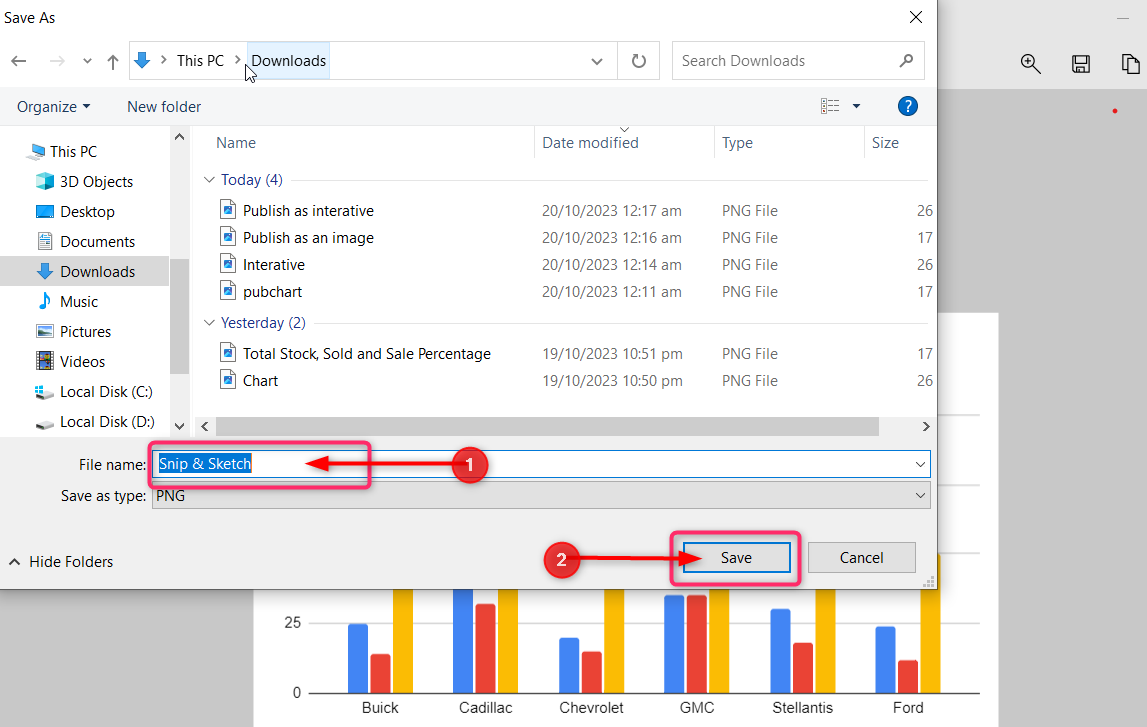
Step 6: Rename the file and click on Save at the bottom:
Conclusion
After creating a chart on Google Sheets, we need to save the chart as an image to share it with some or to create a report. Google Sheets has a built-in download option to download the chart and directly save it as an image on our computer. Another way is to publish the chart on the web. This will create a link to access the chart online as an image. Copy the link and open it in a browser, then right-click the image and save as on the computer. The third way is to take a screenshot of the chart through the snip and sketch tool and save the screenshot as an image.