One of the most frustrating parts about coding is when you have an error you just can’t seem to find or fix. You know the feeling. You crushed a case of Red Bull, put on some headphones, and worked through the night writing hundreds – if not thousands – of lines for your program. Just when you think you’ve got it perfect, you execute and... nothing.
Of course, you could manually go back through your code line by line, looking for a missing variable or a symbol potentially out of place. But if your program has thousands of lines, this could be extremely time consuming and tedious. You might simply skip over your mistake by accident, and even if you do find something wrong, how do you know it’s the only problem in your code?
The best way to effectively solve these errors is by running a debugger.
There are a few reliable debugging programs out there, each with their own merits, that can help you find your mistakes. Seasoned coders will probably already have their preferences. But if you’re a novice or simply looking for a new program to try out, we recommend you learn how to use GDB.
What Exactly is GDB

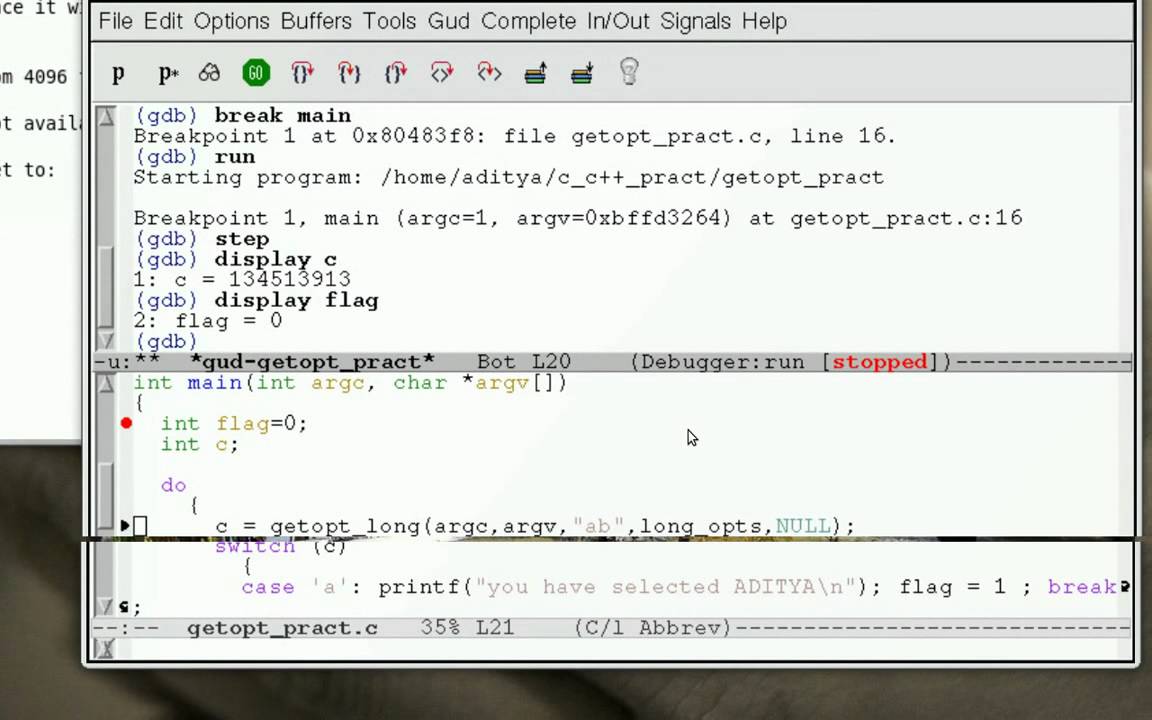
GDB is a free debugger that’s offered from the GNU Project. The debugger allows users to see what was actually happening within a program as it was running, up until the moment it crashed. Users can set up the GDB to start and stop and specific moments in the program and will receive a notification of which line of code caused the program to crash. GDB was traditionally used with programs on the Linux operating system, but it will also work with most popular Windows variants and even macOS. The debugger can also be run using about a dozen popular computer languages, including C and C++.
Downloading GDB is fairly straightforward. The latest version of the debugger can be accessed on the GNU Project FTP server. The GNU Project also offers older versions of GDB going back to 1988. These versions are simply for nostalgia, they most likely won’t work on modern computers and programs.
Helpful Debugging Functions You Can Run in GDB

GDB is a favorite among developers and coders for its simple and yet detailed functions. There are a handful of ways to use the program for your specific needs, and the more detailed you wish to get, the more complicated the steps can be. Many university computer science departments have guides on how to execute these more difficult commands, we’re going to keep it simple.
Using guidance from some of these tutorials, we’ve put together a beginner’s guide with a few of the most basic commands you can utilize once you learn how to use GDB.
1. Setting Up GDB
The first thing you’ll need to do is indicate which program you’d like to debug.
To tell GDB which file you want to test, simply input a “-g” with your GCC right before the program name you’d like to debug. For instance, if your program is named hopscotch, then your prompt in that part of your GCC would appear as “-g hopscotch.”
2. Running Programs in GDB

Once you’ve signified which program to debug, it’s a simple command to begin GDB. Assuming our program is named hopscotch like in the scenario above, you need to input “gdb hopscotch.”
At this point, you should receive a message that provides copyright and license information and some basic rules for GDB – which basically just say the program is free and you are able to make any changes you see fit. At the end of the message you’ll see a prompt that says “(gdb).” To run the program, simply type “run” after this prompt and hit enter.
If your program is clean, it will run as it normally would. But if you have any errors, you’ll receive a message that tells you exactly which line and parameters caused your program to crash.
3. Using Breakpoints in GDB
There might be some instances where it’s advantageous to debug your entire program, but chances are you’ve been testing your code as you’ve progressed so you don’t need the debugger to recheck the lines you know are working correctly.
You can insert break points into your GDB program, which simply tell the debugger to stop at a specific line. If GDB finds an error before this point, you’ll receive an error message with the location and parameters. However, if the debugger makes it to your specified line without encountering an error, you’ll be given another gdb prompt.
To run GDB with a break point, you’ll simply insert the line at which you’d like the program to pause after the program’s name. For instance, if you want GDB to stop after the 10th line of code, you would input the following after the (gdb) prompt: “break hopscotch:10.” You can insert as many breakpoints as you like, but once you give GDB the run command it will stop at your first break point unless it finds an error prior to that line.
In addition, you can also set up a breakpoint for a specific function. This is helpful if you don’t know exactly in which line this function appears. An example would be for “myfunction” which would be described in your code somewhere. Simply enter “break myfunction” after the (gdb) prompt and the debugger will pause when it reaches myfunction.
If you ever need to remove a breakpoint, you can simply type delete and the breakpoint number (your first break point is number 1, the second is number 2, and so on) in the (gdb) prompt.
4. Continue and Step Commands in GDB

If GDB reaches your breakpoint without an error, it will pause the debugger. You’ll need to give more commands here to resume.
You have a few options, but these are the most common:
5. Watchpoints in GDB
While breakpoints are helpful when you want to pause a specific program at a specific spot, watchpoints help keep track of variable and conditions changes. For instance, if you have a variable that you always want to be NULL, a watchpoint will cause the debugger to stop if that variable is ever assigned a valued other than NULL. This functionality is helpful so you don’t have to stop the debugger each time a specific function or condition comes up, but rather only when GDB detects a change.
The command to set up a watchpoint is very similar to the one used to establish a breakpoint. After the (gdb) prompt, you’ll enter “watch” and the variable you want to monitor. Your command would look like this: (gdb) watch myvariable.
6. Help Command in GDB
If these commands do not perform the function in which you’re hoping to run with GDB, the debugger has a crude help menu.
Simply type “help” after the (gdb) prompt and you’ll receive a list of about a dozen classes of commands. Some of these classes include:
From here, you can type “help” followed by a class name and you’ll receive a more detailed list of commands.
If you type “help” followed by a command name you’ll get a complete summary of what that command will do.
Finally, if you type “help all” you’ll receive a full list of commands that are available.
7. Quitting GDB
Once you’re finished running your debug test, don’t forget to quit GDB. This is done by simply typing “q” after the (gdb) prompt and hitting enter.
Start Using GDB to Debug Your Programs

Remember, this is just a basic overview of how to use GDB. By experimenting with different commands, you can test a variety of variables and make changes to your code to see how it will impact your program. Consider the help function to learn additional commands you can use in your tests.
All that’s left to do now is to play with the debugger to see how well it detects errors in your program – or how well you were able to code your program.

